


Showing posts 1 - 3 of 3 matching: graphs
Monday, June 9, 2014
Something Booster Gold Can't Take Credit For
I don't think it's any secret that I don't care for the New 52. I know I'm not alone.
I often hear or read others with long-term DC Comics buying habits express disappointment with the change to the DC Universe. When we malcontents get together, someone invariably invokes sales numbers to prove that most people hate the New 52.
That sounds comforting, but is is true? I looked at the numbers to see for myself.
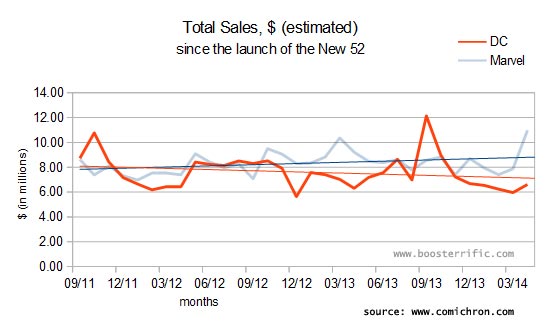
The naysayers have a point. The New 52 is dying a slow death, kept alive largely through increasingly regular injections of "events."
The graph above charts the sales since the launch of the New 52, and the trend lines make it clear that DC is losing ground to their Marvelous Competition. (Let's not pretend that DC's recent changes are anything other than an attempt to close the gap with Marvel, which is more successful in all ways, but especially in the one that counts: sales revenue).
Those spikes in the graph are the initial reboot and last year's "Villains Month" 3D covers. Those 3D covers really seemed to work. Expect to see them more often if this September's Futures End covers are anywhere near as successful. (Living from event to event? Why does that market strategy seem so familiar?)
But before I celebrate the proof that the New 52 is loosing steam, I should put that in perspective and look at what DC was doing before their re-branding:
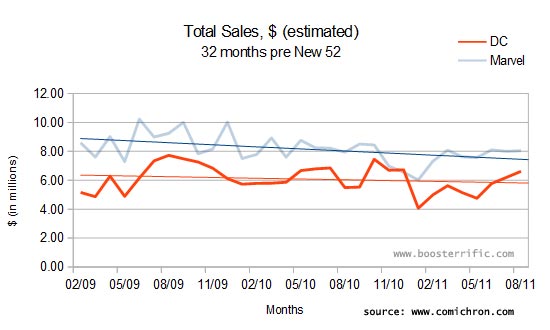
Here I've extended my timeline backwards. We have sales data for 32 months of the New 52 universe, so I decided to look backwards the same distance before the relaunch. Frankly, they don't look so bad. (I can't even blame the sales dip for January 2011 on Flashpoint. That month saw a change in Diamonds' distribution practice, and was a low volume month across the board.)
Ah, but when I put the two timelines together, look what happens:
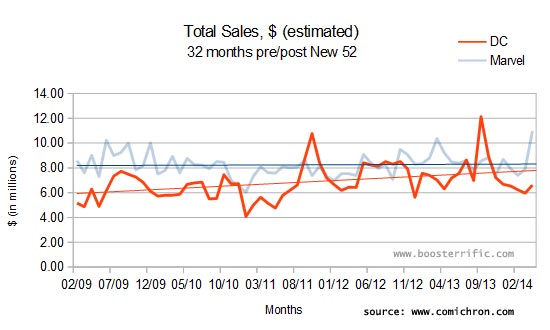
Look at that upswing! And it's probably better than it looks. All of my data comes from ComicChron.com and is based off Diamond Comics Distributors' coded sales charts. That means that my numbers are estimates that do not include digital sales. That probably means that the modern numbers are bigger and better than we can see (at least in months without fancy 3D covers).
It's true that a rising tide floats all boats, and the comics industry is currently experiencing something of a sales renaissance as the economy has rebounded from the Great Recession. However, DC is hitting sales numbers they haven't seen in over a decade. It would be foolish to credit most of that change to anything other than the excitement generated by the launch of the New 52.
Creatively, I still refuse to call the New 52 a success. I can still argue that rebooting to something that I might want to read — such as keeping Wally West as The Flash or reverting Superman to Silver Age godhood — may have produced better, longer lasting gains. What I cannot do is deny that the New 52 gave DC sales momentum unlike any in recent memory. The only question now is when DC will do it again.
Comments (5) | Add a Comment | Tags: comichron.com graphs reboot sales
Monday, July 15, 2013
Booster Gold Versus Guest Stars
Now that the story is over and the numbers are in, I thought it would be fun to look at whether or not choosing to add Booster Gold to All-Star Western did anything to help its anemic sales. In short, the answer is "not really."
I've included the six months of sales prior to Booster's arrival (issues #13 through #18) in the graph for reference. It seems that Booster's arrival in issue #19 may have slowed the defection of readers briefly, but they resumed their flight from the title as the story wore on. If All-Star Western lives or dies based on sales numbers (and not Dan DiDio's favor), Booster's appearance might have bought the title one more issue.
Granted, the numbers in this chart are for print issues only and fail to account for any digital sales. Maybe the book sells like gangbusters online, although since All-Star Western appears in 407th place of ComiXology's "Top Titles" list, that seems unlikely.
Looking at the slope of sales decline, an unexceptional issue #19 should probably have been expected to sell about 16,400 copies. Instead, with Booster's help it sold 16,838 copies. Does that mean that adding Booster to a book boosts sales by 400 copies? If the sales of Smallville are any indication, we should probably assume that it was the "WTF" gatefold cover, not Booster's appearance, that drove up sales for the issue.
Booster's appearance in issue #13 didn't seem to move the sales needle. Sales continued on pace. Although these graphs show decreasing sales, remember that as a general rule, comic sales decrease in a gentle curve from month to month for every title everywhere. That's natural sales entropy, and it's why titles are constantly started over with number 1 issues; it moves the title back to the top of the ladder to start the slide over again.
Did Booster fail to make any mark on Smallville: Season 11's sales because Smallville takes place outside of continuity (whatever that word means in the New 52 Universe)? Was it because Smallville: Season 11 is sold in weekly installments online? Or was it because the people who would buy Smallville are buying anyway, and don't care who the guest star of the week is? Who knows. But whatever you do, don't blame it on Skeets!
Comments (0) | Add a Comment | Tags: all-star western comichron.com comixology.com graphs sales smallville
Friday, January 4, 2013
Counting Down the Hits
For the past three years, I've been keeping record of raw page requests from the Boosterrific.com server. (You'll note a break in the graph around Oct 2012; that was when the forum was being remotely spammed by bots. I have therefore eliminated that data.)

The high water mark was November 2011. The coming of the New 52 sure did generate a lot of buzz, didn't it?
This second graph is what Google says the Boosterrific.com page hits are. Google only tracks hits that activate the embedded Javascript code, so it completely ignores hits from bots and spiders, some mobile devices, and any pages which do have not the Google Analytics code embedded (which includes some of the deeper pages in the site, including the house ads and some forum pages). The numbers from Google are, understandably, considerably lower.
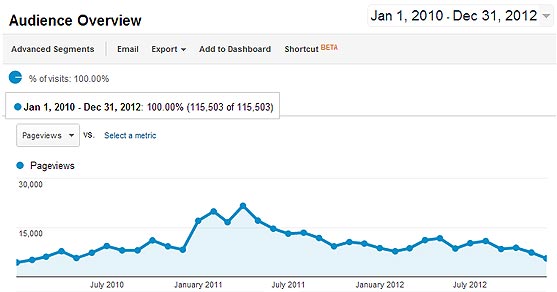
What a big difference automated spiders make! Note that so far as Google is concerned, the apex was in Spring 2011, when the coming of the New 52 was announced. So as the humans departed, robots took over? That sounds about right.
Many thanks to everyone who has visited the site in the past 3 years, especially those of you with eyeballs and fingers.
Comments (0) | Add a Comment | Tags: google graphs website update
SITE SEARCH

SPOILER WARNING: The content at Boosterrific.com may contain story spoilers for DC Comics publications.
Booster Gold, Skeets, and all related titles, characters, images, slogans, logos are trademark ™ and copyright © DC Comics unless otherwise noted and are used without expressed permission. This site is a reference to published information and is intended as a tribute to the artists and storytellers employed by DC Comics, both past and present. (We love you, DC.) Contents of this page and all text herein not reserved as intellectual property of DC Comics is copyright © 2007-2024 BOOSTERRIFIC.com. This page, analysis, commentary, and accompanying statistical data is designed for the private use of individuals and may not be duplicated or reproduced for profit without consent.